# Real-Time Metrics
import Tag from '~/components/webkit/Tag.vue';
import DocButton from '~/components/webkit/DocButton.vue';
**Real-Time Metrics** is an [Observe](/en/documentation/products/observe/) product that provides you with real-time access to metrics, through charts, so you can analyze the events of your applications and products configured on Azion. It also helps you optimize the use of Azion products and how your content is delivered.
By analyzing data through Real-Time Metrics, you can check and track the behavior of your applications in near real time. Real-Time Metrics gives you the opportunity to:
- Gain insights on the performance of your application.
- Examine the availability of your content.
- Quantify accesses and traffic to your content.
- See bandwidth savings.
- Find security threats in real time.
- Troubleshoot problems in real time.
- Compare your application's data through different data intervals.
Real-Time Metrics fetches your data and metrics using [Azion GraphQL API](/en/documentation/devtools/graphql-api/) and generates charts based on its response. The maximum time for data aggregation to occur is **10 minutes**.
You can combine your metrics analysis with [Real-Time Events](/en/documentation/products/observe/real-time-events/) to further inspect your logs.
See the [first steps for Real-Time Metrics](/en/documentation/products/observe/real-time-metrics/first-steps/).
## Grafana plugin
Real-Time Metrics also has an [Azion Grafana plugin](https://github.com/aziontech/grafana-plugin) integration available for local installation. With it, you can use Grafana’s interface to create dashboards and complement your metrics visualization.
Your dashboards can be created using GraphQL queries. You can use it to view and create:
- Top X metrics (such as IP addresses or blocked countries).
- Security metrics.
- Customized alerts.
- Specific status codes.
See how to:
- [Customize your own dashboard](/en/documentation/products/guides/azion-plugin-grafana-custom-dash/)
- [Use use a pre-built dashboard to view Data Transferred graphs](/en/documentation/products/guides/azion-plugin-grafana-pre-built-dash/)
---
## Data storage
Azion stores your metrics' events and logs for 2 years, but the new Real-Time Metrics provides data and metrics starting from **October 15th, 2022**.
If you want to view metrics for up to 2 years and before October 15th, 2022:
---
## Data consideration
When comparing the data displayed on Real-Time Metrics and Azion Billing data, you may find differences. Real-Time Metrics focuses on performance, using an at-most-once approach, while Billing seeks precision, using an exactly-once approach. If you find such differences, you should consider Azion Billing data as the correct one.
On average, the difference between the two is smaller than 1%. See [Azion Pricing](/en/documentation/products/pricing/) and the [Billing documentation](/en/documentation/products/accounts/billing-and-subscriptions/) for more information.
---
## Product choice to view metrics
**Real-Time Metrics** allows you to analyze your applications' metrics through several products, indicated by separate tabs according to their category. You can choose to visualize your metrics through the following categories:
- Build
- Secure
- Observe
After selecting the category you want, you can select a product to view metrics.
On the **Build** tab, you'll find metrics related to:
- Applications
- Tiered Cache
- Functions
- Image Processor
On the **Secure** tab, you'll find metrics related to:
- WAF
- Edge DNS
- Bot Manager
- Threats Breakdown
On the **Observe** tab, you'll find metrics related to:
- Data Stream
After selecting one of the category tabs and the product tab, you'll see the available charts for that specific product according to the data on your account. If you select Data Stream, for example, you'll see charts related to the streams configured in your account.
Some products, such as **Applications**, can also have subtabs, which separate different types of metrics for the same product. Each set of charts composes a dashboard. Find out more about each tab, subtab, and charts in the [Metrics' monitoring with charts](#metrics-monitoring-with-charts) section.
You must subscribe and activate the following products to view their metrics:
- Data Stream
- Functions
- Edge DNS
- Image Processor
- Tiered Cache
- Bot Manager
---
## Data interval
After you decide which product you'll be analyzing, you need to configure a data interval to fetch data for your charts.
On **Real-Time Metrics'** screen, just before the section with the charts, you find the date interval filter, with two parts:
- **Time range**: options to select the time period you want to use to exhibit data on your charts. By default, it comes with the **Last Hour** range selected, but you can choose between:
- Last Hour
- Last 24 Hours
- Last 7 Days
- Last 30 Days
- Last 6 Months
When you select **Last Hour**, Real-Time Metrics automatically refreshes your data every one minute.
- **Date calendar**: calendar field with the date and time of your chosen time range. When you select a time range, it automatically sets the begin and end dates. If you want to use a different time range, you need to manually set up the beginning and ending dates in the calendar fields.
The timezone used is the same as the one configured in your user preferences.
After you configure the **Time range** and **Date calendar** fields, your charts are refreshed to fetch the data related to the new configured data interval.
---
## Filters
**Real-Time Metrics** allows you to filter your analysis, receiving specific fields and values. You can add a single or multiple filters depending on the analysis you want to conduct.
:::tip
After you apply a filter, the URL path on Azion Console is updated with an encoded parameter. You can copy and share it with other users so they can view the charts with the same filters applied.
:::
---
## Chart view
On the second section of **Real-Time Metrics**, after the configuration filters, you find all the available charts.
:::note
The last point of the graph may appear as a downward metric. This occurs because the last data are still being aggregated, and thus appear to be dropping. For example: it's 3:40 PM now and you've requested data for the last 3 days. The data from 3-4 PM is still being calculated and aggregated, so the graph visualization may seem to have drop in the metrics.
:::
Each chart displays the following properties:
- **Title**: descriptive name for the graph.
- **Type of chart**: tag representing who created the chart and to whom it's available for.
- **Azion Chart**: chart displayed by default by Azion's servers.
- **Context menu**: extra options of actions related to the chart.
- **(?) Open Help Center**: opens a Help Center article, which you can use to discover more about each chart and find a few tips and practical examples.
- **Copy Query**: to copy the query of that specific chart to your clipboard.
- **Export CSV**: to download and export the points presented on that specific chart according to the data displayed.
- **Show Mean Line/Hide Mean Line**: to exhibit or stop exhibiting the average value of the chart. Each point of the chart is summed and divided by the total number of points, generating a mean for the data shown on that specific chart and time period.
- **Show Mean Line per series**: to exhibit or stop exhibiting the average value for each data series in the chart. Instead of calculating a single mean for all points, it calculates and overlays a mean line for each individual series, helping to compare trends across different data sets.
- **Description**: a short text that explains what data that specific chart displays.
- **Aggregator**: type of aggregation being used in the query to generate the metrics on the chart. Either `Sum` or `Avg`.
- **Variation tag**: information shown on chart with only one series. It provides a percentage comparing the previous and current values of the chart in the corresponding time period. The tag shows a **↑** if the current value is larger, a **↓** if the previous value was larger, and no sign if the value is the same. Example: if you're using the "Last hour" period and it's 10:00, the chart shows data for the period from 9:00-10:00, and the feedback will show a comparison with the data from 8:00-9:00. The colors indicate whether the metric is improving or worsening based on its direction (increase or decrease). For example, **+10% (green)** in OFFLOAD means the OFFLOAD metric is better when it increases, while MISSED DATA appears in **red** when it increases, indicating the opposite behavior.
- **Graph series**: representation of data categories.
- Example: in a line graph that shows the number of requests over time, you can have several series, each one representing a different domain. Each series will have data points connected by a line to exhibit how the number of requests varied over time for each domain.
- **Tooltip**: information available by hovering the cursor over the graph series, which displays the value and the name of each series of that specific point in a descending order, according to the value. This feature isn't available for viewports smaller than 540px.
- **Time interval line**: the x-axis of the graph, representing the time period line for the data on the graph.
- **Legend**: a list that reflects and describes series and data from the y-axis, based on the chart's aggregation type. You can select and deselect each legend item to change the data displayed on the graph.
Legends can be displayed differently according to the type of chart and amount of series represented on it. They can appear on the *bottom* of the chart or on the *right side*, and the legend exhibits a maximum of *16 series* per graph.
:::note
When you use the **Copy Query** button and paste it on the [GraphQL playground](https://console.azion.com/metrics/graphql), you need to move what's exhibited under "VARIABLES" to the "**QUERY VARIABLES**" section, on the bottom of the page.
:::
---
## Metrics' monitoring with charts
In the second section of Real-Time Metrics, right after the data interval filter, you find all the available charts for your account.
Even after you configure a data interval filter, you can still navigate through tabs and change the product you want to view metrics from. After you select a tab and, possibly, subtab, you can analyze your data for each chart.
Next, you can find detailed information about each tab and subtabs and about each of the charts available:
- [Build](#build)
- [Applications](#edge-applications) _-_ [Tiered Cache](#tiered-cache) _-_ [Functions](#edge-functions) _-_ [Image Processor](#image-processor)
- [Secure](#secure)
- [WAF](#waf) _-_ [Edge DNS](#edge-dns) _-_ [Bot Manager](#bot-manager)
- [Observe](#observe)
- [Data Stream](#data-stream)
---
## Build
### Applications
The **Applications** tab displays metrics related to the accesses of your [Applications](/en/documentation/products/build/applications/) configured in your account. You find four subtabs with different charts: [Data Transferred](#data-transferred), [Requests](#requests), [Status Codes](#status-codes), and [Bandwidth Saving](#bandwidth-saving).
#### Data Transferred
Find out more about each chart:
import EdgeCaching from "~/includes/docs_help_center/en/real-time-metrics/edge-applications/data-transferred/edge-caching/index.md"
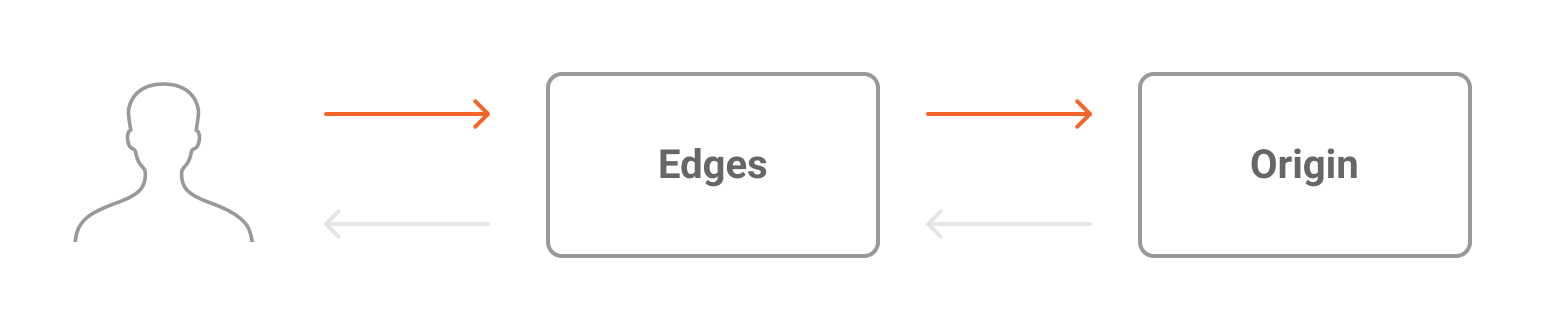
**Data Transferred In** flow:
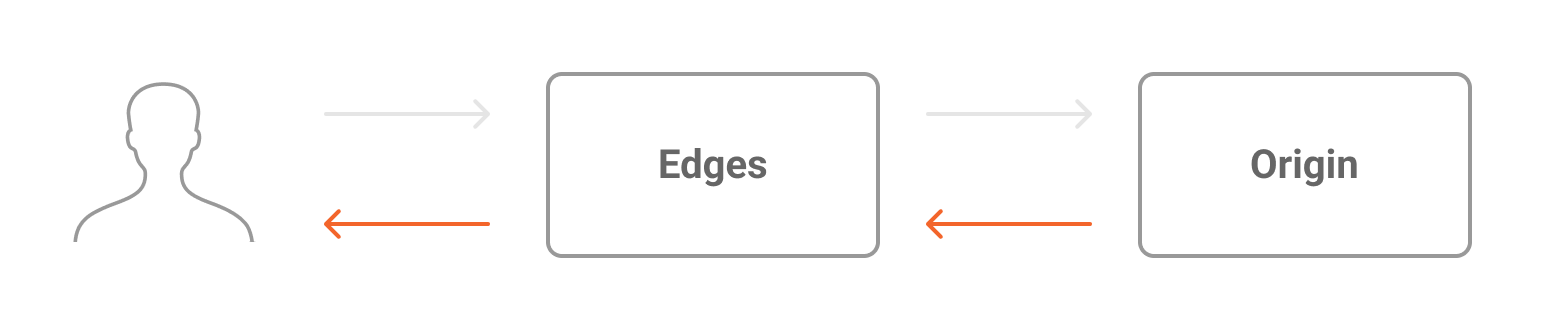
**Data Transferred Out** flow:
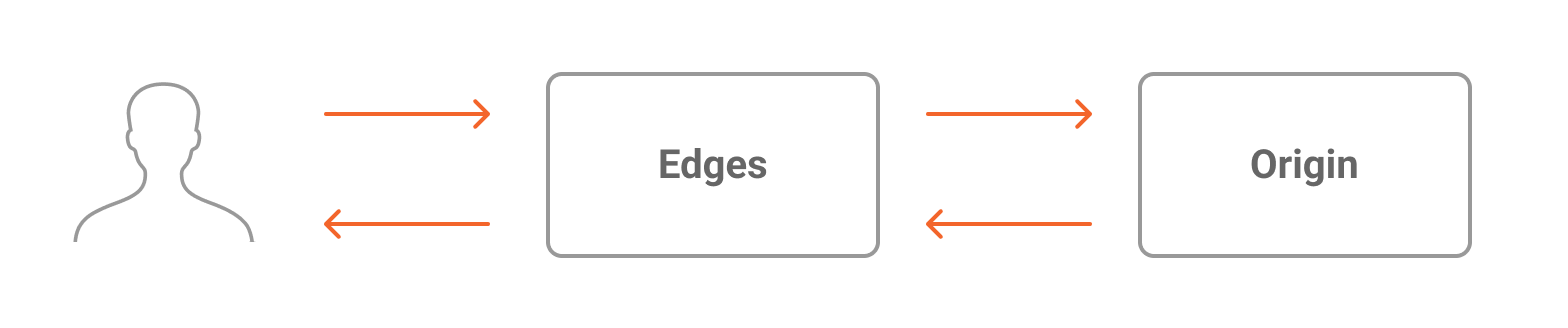
**Data Transferred** flow:
If you have [Tiered Cache](/en/documentation/products/build/applications/cache/tiered-cache/) enabled, your Cache graph will exhibit:
- **Data Transferred In**: data transferred from the end user to the edges, and from the edges to the tiered cache layer.

- **Data Transferred Out**: data transferred from the tiered cache layer to the edges, and from the edges to the end user.

- **Data Transferred Total**: all data that was transferred in the process; value of Data Transferred In + Data Transferred Out.

import EdgeOffload from "~/includes/docs_help_center/en/real-time-metrics/edge-applications/data-transferred/edge-offload/index.md"
import SavedData from "~/includes/docs_help_center/en/real-time-metrics/edge-applications/data-transferred/saved-data/index.md"
import MissedData from "~/includes/docs_help_center/en/real-time-metrics/edge-applications/data-transferred/missed-data/index.md"
import TotalBandwidthUsage from "~/includes/docs_help_center/en/real-time-metrics/edge-applications/data-transferred/total-bandwidth-usage/index.md"
import BandwidthOffloaded from "~/includes/docs_help_center/en/real-time-metrics/edge-applications/data-transferred/bandwidth-offloaded/index.md"
import SavedBandwidth from "~/includes/docs_help_center/en/real-time-metrics/edge-applications/data-transferred/saved-bandwidth/index.md"
import MissedBandwidth from "~/includes/docs_help_center/en/real-time-metrics/edge-applications/data-transferred/missed-bandwidth/index.md"
#### Requests
Find out more about each chart:
import TotalRequests from "~/includes/docs_help_center/en/real-time-metrics/edge-applications/requests/total-requests/index.md"
import RequestsOffloaded from "~/includes/docs_help_center/en/real-time-metrics/edge-applications/requests/requests-offloaded/index.md"
import SavedRequests from "~/includes/docs_help_center/en/real-time-metrics/edge-applications/requests/saved-requests/index.md"
import MissedRequests from "~/includes/docs_help_center/en/real-time-metrics/edge-applications/requests/missed-requests/index.md"
import TotalRequestsPerSecond from "~/includes/docs_help_center/en/real-time-metrics/edge-applications/requests/total-requests-per-second/index.md"
import RequestsPerSecondOffloaded from "~/includes/docs_help_center/en/real-time-metrics/edge-applications/requests/requests-per-second-offloaded/index.md"
import SavedRequestsPerSecond from "~/includes/docs_help_center/en/real-time-metrics/edge-applications/requests/saved-requests-per-second/index.md"
import MissedRequestsPerSecond from "~/includes/docs_help_center/en/real-time-metrics/edge-applications/requests/missed-requests-per-second/index.md"
import RequestsByMethod from "~/includes/docs_help_center/en/real-time-metrics/edge-applications/requests/requests-by-method/index.md"
###### Average Request Time
The **Average Request Time** graph shows the average duration of requests over a specified period. It measures how long, on average, a server or application takes to process and respond to a request.
With this information, you can quickly identify trends and patterns in request processing times, such as bottlenecks or issues requiring attention. If you identify these issues, you can address them with solutions such as:
- [Improve your database queries](/en/documentation/devtools/graphql-api/queries/) for optimal performance.
- [Define cache policies](/en/documentation/products/guides/cache-settings/) and [Advanced Cache Key](/en/documentation/products/guides/advanced-cache-key/).
- [Configure multiple origins with load balancing algorithms](/en/documentation/products/guides/build/multiple-origins/).
> **In what unit does data appear on graphs?**
>
> Real-Time Metrics uses averages of seconds to show your data. Example: 1.7/s
### Practical example
You can use the Metrics filters to refine your analysis by focusing on specific criteria, such as host, status code, request method, or geographic location. For example, in the **Filter** section, you can use **Host**, **Equals**, and **example.com** to see the average request time for each host.
###### Requests by Scheme
The **Requests by Scheme** graph displays the total number of requests over the selected period, categorized by scheme.
It breaks down traffic into:
- **HTTP**: requests transmitted without encryption, which may be vulnerable to interception.
- **HTTPS**: requests secured with encryption, ensuring data integrity and confidentiality.
With this information, you can analyze how requests are being handled and identify trends in secure (encrypted) versus non-secure traffic. Read more on [How to configure HTTP and HTTPS ports for origins and delivery address](/en/documentation/products/guides/configure-ports/).
#### Status Codes
Find out more about each chart:
import HttpStatusCodes2xx from "~/includes/docs_help_center/en/real-time-metrics/edge-applications/status-codes/http-status-codes-2xx/index.md"
import HttpStatusCodes3xx from "~/includes/docs_help_center/en/real-time-metrics/edge-applications/status-codes/http-status-codes-3xx/index.md"
import HttpStatusCodes4xx from "~/includes/docs_help_center/en/real-time-metrics/edge-applications/status-codes/http-status-codes-4xx/index.md"
import HttpStatusCodes5xx from "~/includes/docs_help_center/en/real-time-metrics/edge-applications/status-codes/http-status-codes-5xx/index.md"
###### Requests by Status and Upstream Status
The **Requests by Status and Upstream Status** table shows the total number of processed requests, categorized by both Status Codes (responses generated by your application or infrastructure) and Upstream Status Codes (responses returned by upstream servers or external services).
The table is divided into:
- **Status**: indicates how requests were processed at the edge, such as successful responses (2XX), client errors (4XX), or server errors (5XX).
- **Upstream Status**: provides insights into responses from external services or backend servers, helping identify connectivity issues, timeouts, or failures in upstream dependencies.
- **Total**: the sum of the requests according to the Status and Upstream Status.
By analyzing this graph, you can detect trends in request handling, pinpoint sources of errors, and optimize your infrastructure for better performance and reliability.
The graph includes the 10 most frequent request cases, but you can apply filters to access more specific information.
#### Bandwidth Saving
import BandwidthSaving from "~/includes/docs_help_center/en/real-time-metrics/edge-applications/bandwidth-saving/bandwidth-saving/index.md"
#### Requests Breakdown
###### IP Address Information
The **IP Address Information** table provides an overview of the distribution of requests based on different geographical and network attributes, breaking them down by:
- **Remote Address**: individual IP addresses making requests.
- **ASN**: Autonomous System Number, the network operator or organization responsible for the IP address.
- **Country**: the specific country from which the requests are coming.
- **Region**: the geographic location from which the requests originate.
- **Total**: the total number of requests associated with a specific Remote Address.
By examining this data, you can identify regional traffic patterns, detect unusual activity from specific countries or networks, and take targeted security actions. For example, you can create a [network list based on user’s IP addresses or geolocation](/en/documentation/products/guides/blocklists-ip-addresses-edge/) to block these requests.
The table displays the 10 most frequently used Remote Addresses, but you can apply filters to access more specific information.
### Tiered Cache
The Tiered Cache tab displays metrics related to the data of your applications using [Tiered Cache](/en/documentation/products/build/applications/cache/tiered-cache/) configured in your account.
Find out more about each chart:
import L2Caching from "~/includes/docs_help_center/en/real-time-metrics/l2-caching/caching-offload/l2-caching/index.md"
**Tiered Cache** flow:

**Tiered Cache In** flow:

**Tiered Cache Out** flow:

import L2Offload from "~/includes/docs_help_center/en/real-time-metrics/l2-caching/caching-offload/l2-offload/index.md"
### Functions
The **Functions** tab displays metrics related to the invocations of the [Functions](/en/documentation/products/build/applications/functions/) configured in your account.
Find out more about the chart:
import TotalInvocations from "~/includes/docs_help_center/en/real-time-metrics/edge-functions/invocations/total-invocations/index.md"
### Image Processor
The **Image Processor** tab displays metrics related to the requests made to your images processed through [Image Processor](/en/documentation/products/build/applications/image-processor/) configured in your account.
Find out more about each chart:
import TotalRequestsIp from "~/includes/docs_help_center/en/real-time-metrics/image-processor/requests/total-requests/index.md"
import TotalRequestsPerSecondIp from "~/includes/docs_help_center/en/real-time-metrics/image-processor/requests/total-requests-per-second/index.md"
---
## Secure
### WAF
The **WAF** tab displays metrics related to [threats protected by WAF](/en/documentation/products/secure/firewall/web-application-firewall/) in your account.
Find out more about each chart:
import ThreatsVsRequests from "~/includes/docs_help_center/en/real-time-metrics/waf/threats/threats-vs-requests/index.md"
import CrossSiteScriptingXssThreats from "~/includes/docs_help_center/en/real-time-metrics/waf/threats/cross-site-scripting-xss-threats/index.md"
import RemoteFileInclusionRfiThreats from "~/includes/docs_help_center/en/real-time-metrics/waf/threats/remote-file-inclusion-rfi-threats/index.md"
import SqlInjectionThreats from "~/includes/docs_help_center/en/real-time-metrics/waf/threats/sql-injection-threats/index.md"
import OtherThreats from "~/includes/docs_help_center/en/real-time-metrics/waf/threats/other-threats/index.md"
###### Top WAF Threat Requests by Country Pie Graph
The **Top WAF Threat Requests by Country** pie graph shows the distribution of requests identified as threats by the Web Application Firewall (WAF).
It breaks down the data by country, highlighting the top sources of flagged requests. The graph displays percentages, allowing you to quickly assess which regions generate the most WAF-detected threats over the selected period.
You can use this alongside the bar graph that shows the total number of detected threats, providing a deeper analysis to identify trends and patterns in the origins of the threats.
With this information, you can set up security policies. For example, you can create a [network list based on the user's geolocation](/en/documentation/products/guides/blocklists-ip-addresses-edge/) to block these requests.
###### Top WAF Threat Requests by Country Bar Graph
The **Top WAF Threat Requests by Country** bar graph shows the distribution of requests identified as threats by the Web Application Firewall (WAF).
It breaks down the data by country, highlighting the top sources of flagged requests. The graph displays the number of threats by country, allowing you to quickly assess which regions generate the most WAF-detected threats over the selected period.
You can use this alongside the pie graph that displays the distribution of requests identified as threats in percentages, providing a deeper analysis to identify trends and patterns in the origins of the threats.
With this information, you can set up security policies. For example, you can create a [network list based on the user’s geolocation](/en/documentation/products/guides/blocklists-ip-addresses-edge/) to block these requests.
###### WAF Threat Requests by Family Attack
The **WAF Threat Requests by Family Attack** graph displays the total number of requests identified as threats by the WAF, categorized by attack family over the selected period.
> The graph is divided into:
>
> - **SQL**: attempts to exploit SQL injection vulnerabilities to manipulate database queries.
> - **SQL, XSS**: requests that combine SQL injection with Cross-Site Scripting (XSS) attacks.
> - **SQL, TRAVERSAL**: attacks leveraging both SQL injection and path traversal techniques to access restricted files or directories.
> - **OTHERS, SQL**: less common SQL-related attack patterns grouped.
> - **RFI**: Remote File Inclusion attacks that attempt to load external malicious scripts.
> - **TRAVERSAL**: directory traversal attempts to access unauthorized files or directories.
> - **SQL, RFI**: attacks that combine SQL injection and Remote File Inclusion techniques.
> - **SQL, XSS, RFI**: multi-vector attacks that leverage SQL injection, Cross-Site Scripting (XSS), and Remote File Inclusion (RFI).
> - **OTHERS**: attack patterns that don’t fit into the predefined categories.
This graph helps you quickly identify which attack families are generating the most flagged requests, allowing for a clearer analysis of threat patterns and setting up policies to contain these threats. For example, by [creating a WAF Rules Set](/en/documentation/products/guides/secure/create-waf-rule-set/), you can protect your Applications against specific threat families.
> **How does a WAF Rules Set work?**
>
> Each threat receives a score and it's processed according to the sensitivity level set.
>
> If there's more than one case for the same threat type, the score will increase.
>
> After creating a rule set, you must [create a Rules Engine rule](/en/documentation/products/guides/secure/create-waf-rule-set/) to execute the criteria and behavior. For example, if a request has a high SQL score (criteria), it'll be dropped (behavior).
###### WAF Threat Requests by Host
The **WAF Threat Requests by Host** graph displays the total number of requests identified as threats by the WAF, categorized by the top hosts generating the most flagged requests over the selected period.
This graph helps you quickly identify which hosts are responsible for the highest volume of detected threats. By analyzing this data, you can take targeted security measures to mitigate risks, protect your applications, and take proactive steps to mitigate potential risks. For example:
- [Analyze flagged request logs](/en/documentation/products/secure/troubleshoot/firewall-understand-metrics/) to identify patterns or potential vulnerabilities that need addressing.
- [Adjust WAF Rules Sets](/en/documentation/products/guides/secure/create-waf-rule-set/) to strengthen filtering policies to block or challenge suspicious requests from high-risk hosts.
- [Implement rate limiting](/en/documentation/products/secure/firewall/rules-engine/#set-rate-limit) and restrict the number of requests from specific hosts to prevent abuse.
- [Define blocklists](/en/documentation/products/guides/blocklists-ip-addresses-edge/) with identified threat sources to prevent repeated attacks.
### Edge DNS
The **Edge DNS** tab displays metrics related to [queries made to the DNS](/en/documentation/products/secure/edge-dns/) configured in your account.
Find out more about the chart:
The Total Queries graph shows you the total amount of queries received by your DNS configured on [Edge DNS](/en/documentation/products/secure/edge-dns/).
By using Edge DNS, your domains are hosted and managed on Azion. Then, whenever a query is made to your DNS during the period you've selected in the time range, the graph displays it.
### Bot Manager
The **Bot Manager** tab displays metrics related to Bot Manager activity. It has two sections: **Overview** and **Breakdown**.
:::note
To visualize these graphs, you must be subscribed to Azion Bot Manager. Contact the [Sales team](https://www.azion.com/en/contact/) for more details on the subscription.
:::
Find out more about each chart:
#### Overview
##### Bad Bot Hits
The Bad Bot Hits graph shows the total number of requests identified as bad bots within the defined period.
Azion Bot Manager analyzes incoming requests and gives them a score. If the score is equal to or greater than the predetermined threshold you set when configuring Bot Manager, the request is considered a bad bot, and the defined action is executed. Otherwise, the request is processed.
##### Good Bot Hits
The Good Bot Hits graph shows the number of requests identified as good bots within the defined period.
Azion Bot Manager analyzes incoming requests and gives them a score. If the score is equal to or greater than the predetermined threshold you set when configuring Bot Manager, the request is considered a bad bot, and the defined action is executed. Otherwise, the request is processed normally. Good bots are classified as allowed traffic, and their requests proceed as usual.
##### Bot Hits
The Bot Hits graph shows the total number of requests identified as bots within the defined period. A request is considered a bot when it exhibits non-human characteristics or behavior, including abnormal patterns, missing or unusual request headers, suspicious user-agent strings, requests from IP addresses with a history of malicious activity, failing challenges such as CAPTCHAs, or automation tools.
In this context, bots can be either good or bad. Good bots, like search engine crawlers, are permitted. Bad bots, however, engage in harmful activities like scraping data, launching attacks, or overloading systems.
Azion Bot Manager analyzes incoming requests and gives them a score. If the score is equal to or greater than the predetermined threshold you set when configuring Bot Manager, the request is considered a bad bot, and the defined action is executed. Otherwise, the request is processed.
##### Transactions
The Transactions graph shows a sum referring to the total number of requests evaluated by Azion Bot Manager.
##### Bot Traffic
The Bot Traffic graph shows the evolution of bot traffic over time. It presents historical data by identifying the traffic into:
- **Legitimate**: the request wasn't identified as an attack and there's enough data to ensure it isn't an attack, being considered legitimate human users.
- **Bad Bot**: the request reached the score threshold or it was identified as an attack.
- **Good Bot**: the request wasn't identified as an attack and matched any of the commonly used good bots, such as search engines.
- **Under Evaluation**: the request wasn't identified as a bot, but there isn't enough data to ensure it isn't an attack, being considered suspicious access.
It helps to identify periods of suspicious activity and allows you to detect patterns and anomalies. By hovering over the lines in the graph, a card will appear with more detailed information about the date, time, and the number of bots in each category.
###### Top Bot Traffic
The **Top Bot Traffic** graph is a pie chart that displays the distribution of bot traffic in percentages over the selected period. It categorizes traffic into:
- **Legitimate**: the request wasn't identified as an attack and there's enough data to ensure it isn't an attack, being considered legitimate human users.
- **Bad Bot**: the request reached the score threshold or it was identified as an attack.
- **Good Bot**: the request wasn't identified as an attack and matched one of the commonly used good bots, such as search engines.
- **Under Evaluation**: the request wasn't identified as a bot, but there isn't enough data to ensure it isn't an attack, being considered suspicious access.
This graph helps you quickly assess the proportion of bot traffic, detect anomalies, and identify trends in malicious or suspicious activity.
By hovering over the graph, a card will appear with the total number of requests for each category.
##### Top Bot Action
The Top Bot Action graph shows the actions performed by Azion Bot Manager for accesses identified as bots.
These actions could be:
- **Allow**: allowed the continuation of the request. If the score is less than the predetermined threshold, the request is processed, being `allow` the default action.
- **Deny**: delivered a standard **Status Code 403** response.
- **Drop**: terminated the request without a response to the user.
- **Redirect**: allowed the request to be redirected to a new URL/location when the security threshold is reached, including CAPTCHA challenges.
- **Custom_html**: delivered customized HTML content to the user in a threshold violation.
- **Random_delay**: made the function wait for a random period between *1 and 10 seconds* before allowing the request to proceed.
- **Hold_connection**: held the request, keeping the connection open for *1 minute* before dropping it.
##### Bot CAPTCHA line graph
The Bot CAPTCHA metric refers to the results of the challenge returned for requests classified as bots. This metric is presented in two graphics: a pie and a line graph.
In the case of the line graph, it displays the traffic identified as bots over time, being:
- **Solved**: if the challenge was solved. In this case, the bot completed the CAPTCHA challenge, providing the correct response and proceeding.
- **Not Solved**: if the challenge wasn't solved or was solved incorrectly. In this case, the bot either failed to complete the challenge provided an incorrect response, or didn't attempt to solve it, triggering the defined action for blocked or suspicious bots.
By hovering over the lines in the graph, a card will appear with more detailed information about the date and time, as well as the number of bots that either passed or failed the CAPTCHA.
##### Top Bot CAPTCHA Pie Graph
The Bot CAPTCHA metric refers to the results of the challenge returned for requests classified as bots. This metric is presented in two graphics: a pie and a line graph.
In the case of the pie graph, it displays the percentage of bots that either passed or failed the CAPTCHA, being:
- **Solved**: if the challenge was solved. In this case, the bot completed the CAPTCHA challenge, providing the correct response and proceeding.
- **Not Solved**: if the challenge wasn't solved or was solved incorrectly. In this case, the bot either failed to complete the challenge provided an incorrect response, or didn't attempt to solve it, triggering the defined action for blocked or suspicious bots.
It helps to adjust the difficulty or frequency of challenges to improve bot detection. It's also useful for optimizing user experience and the effectiveness in bot mitigation.
##### Top Bot Classifications
The Top Bot Classifications graph shows you the *sum* of requests classified according to the tactics used and the purpose of the bots, including Crawling, Brute Force, Scraping, Bad Bot Signatures, Malicious Browser Behavior, Scripted Bots, Enterprise Bots, Reputation Intelligence, Monitoring Bots, and Malicious Intent Detected, among others.
##### Bot Activity Map
The Bot Activity Map displays the geographic origin of bot attacks.
Countries are color-coded based on the number of detected bot attacks:
- **Red**: more than 1,000,000 requests.
- **Light red**: between 100,000 and 1,000,000 requests.
- **Orange**: between 10,000 and 99,999 requests.
- **Light orange**: between 1,000 and 9,999 requests.
- **Yellow**: between 1 and 999 requests.
This information helps you identify regional patterns and implement geo-blocking and other region-specific mitigation strategies.
#### Breakdown
##### Impacted URLs
The Impacted URLs graph shows the total number of distinct URLs bots request.
##### Top Impacted URLs
The Top Impacted URLs graph shows the total number of requests detected as bots, broken down by the most affected URLs.
This allows you to identify which URLs are most frequently targeted by bots, empowering you to analyze patterns and define more protective measures.
##### Top Bad Bot IPs
The Top Bad Bot IPs graph shows the total number of requests detected as bad bots from different IP addresses, listing those with the highest activity.
You can use this data to:
- Identify IP addresses frequently used by bad bots to attack your site.
- Discover trends and patterns in bad bot activity.
- Block or limit traffic from risky IP addresses.
- Gain insights to respond quickly to bad bots attacks.
### Threats Breakdown
###### Top WAF Threat Requests by IP
The **Top WAF Threat Requests by IP** graph shows the sum of requests identified as threats by WAF, broken down by the top IP addresses. It displays the total number of requests detected as threats for each IP.
With this information, you can quickly identify your traffic and focus on creating policies to stop the biggest threats. For example, you can create a [network list based on user's IP addresses](/en/documentation/products/guides/blocklists-ip-addresses-edge/) to block these requests.
> For a more detailed view of the threats occurring against your domains, see your logs through [Real-Time Events](/en/documentation/products/observe/real-time-events/).
---
## Observe
### Data Stream
The Data Stream tab displays metrics related to the data and requests of the [stream](/en/documentation/products/observe/data-stream/) configured in your account.
Find out more about each chart:
import TotalDataStreamed from "~/includes/docs_help_center/en/real-time-metrics/data-streaming/requests/total-data-streamed/index.md"
import TotalRequestsDts from "~/includes/docs_help_center/en/real-time-metrics/data-streaming/requests/total-requests/index.md"
---
## Limits
:::tip
**Increase limits**
You can request to increase the limits based on your plan. Contact the [technical support team](/en/documentation/services/support/) to request it.
:::
These are the **default limits**:
| Scope | Limit |
| ------- | ----- |
| Log retention | 24 months |
| UI queries | 120 requests per minute |
| GraphQL API data transferred | 10,000 lines |
| GraphQL API maximum fields | 35 fields |
| GraphQL API maximum payload | 5 GB |
| GraphQL API queries | 120 requests per minute |